Schema Visualizer: Visual Collaboration for Data Schemas
Overview
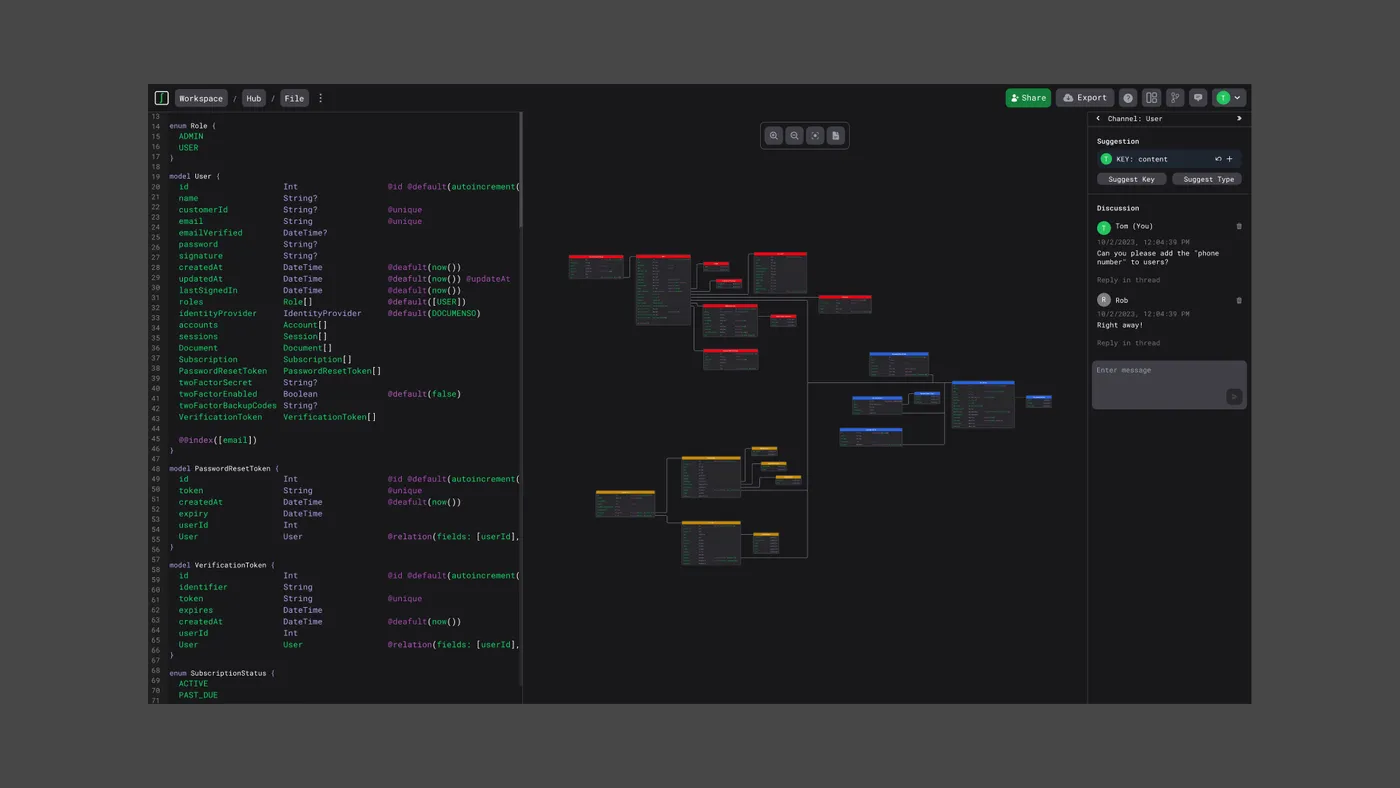
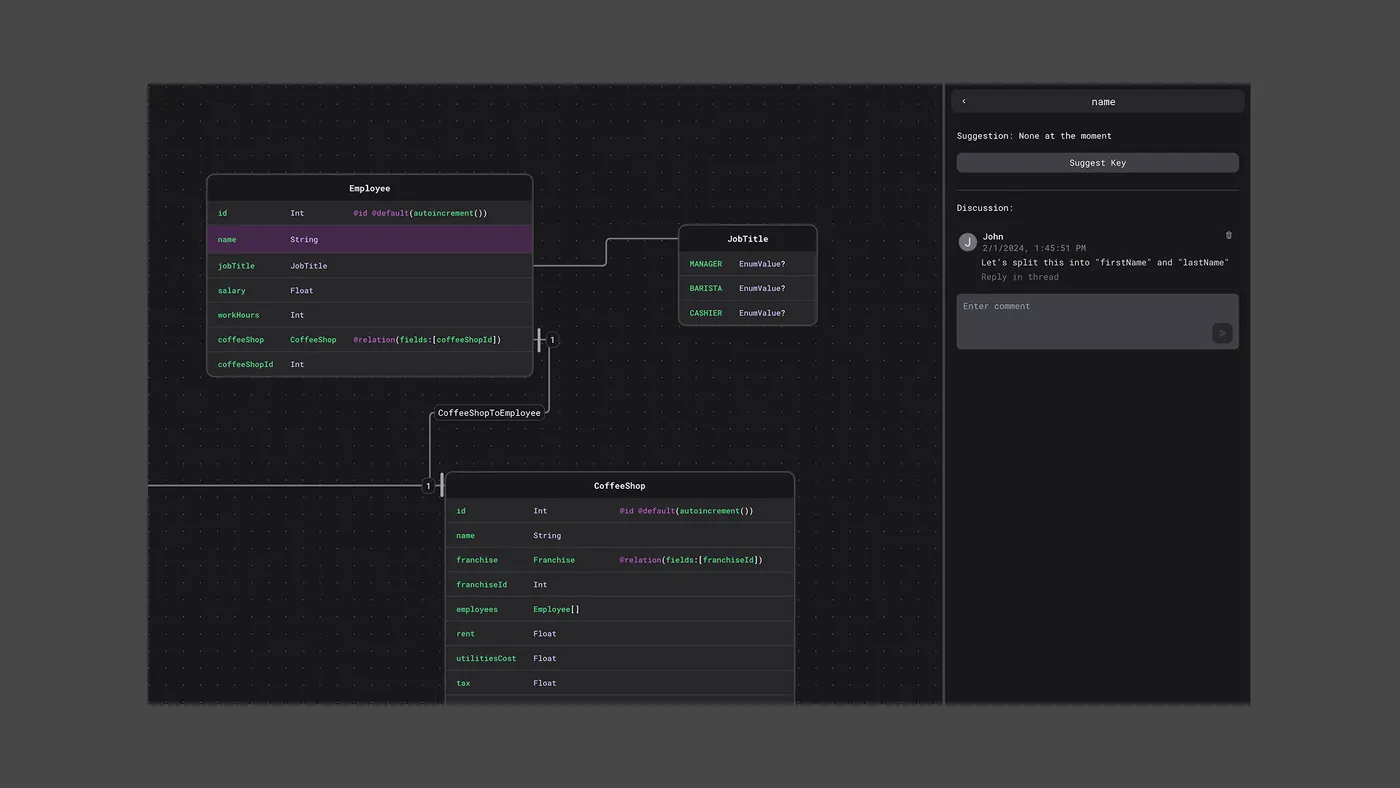
Schema Visualizer transforms complex data schemas into interactive visual diagrams with real-time collaboration. As Designer, UX Strategist, and Frontend Engineer, I created this MVP to make code-level schemas accessible to technical and non-technical stakeholders.
Challenge:
Schema definitions exist as text-based code, creating communication barriers between engineers, product managers, and external partners. Documentation constantly falls out of sync with evolving schemas.
Solution:
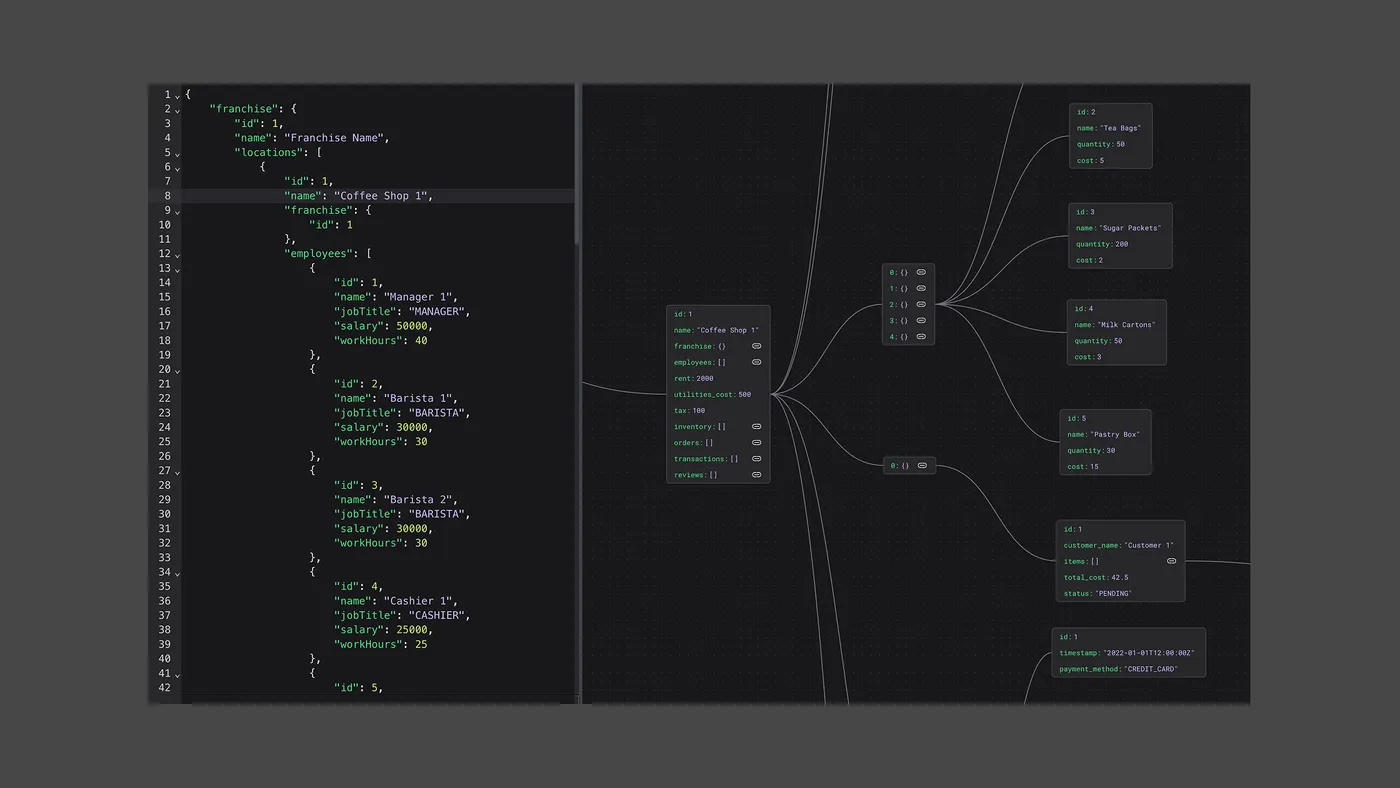
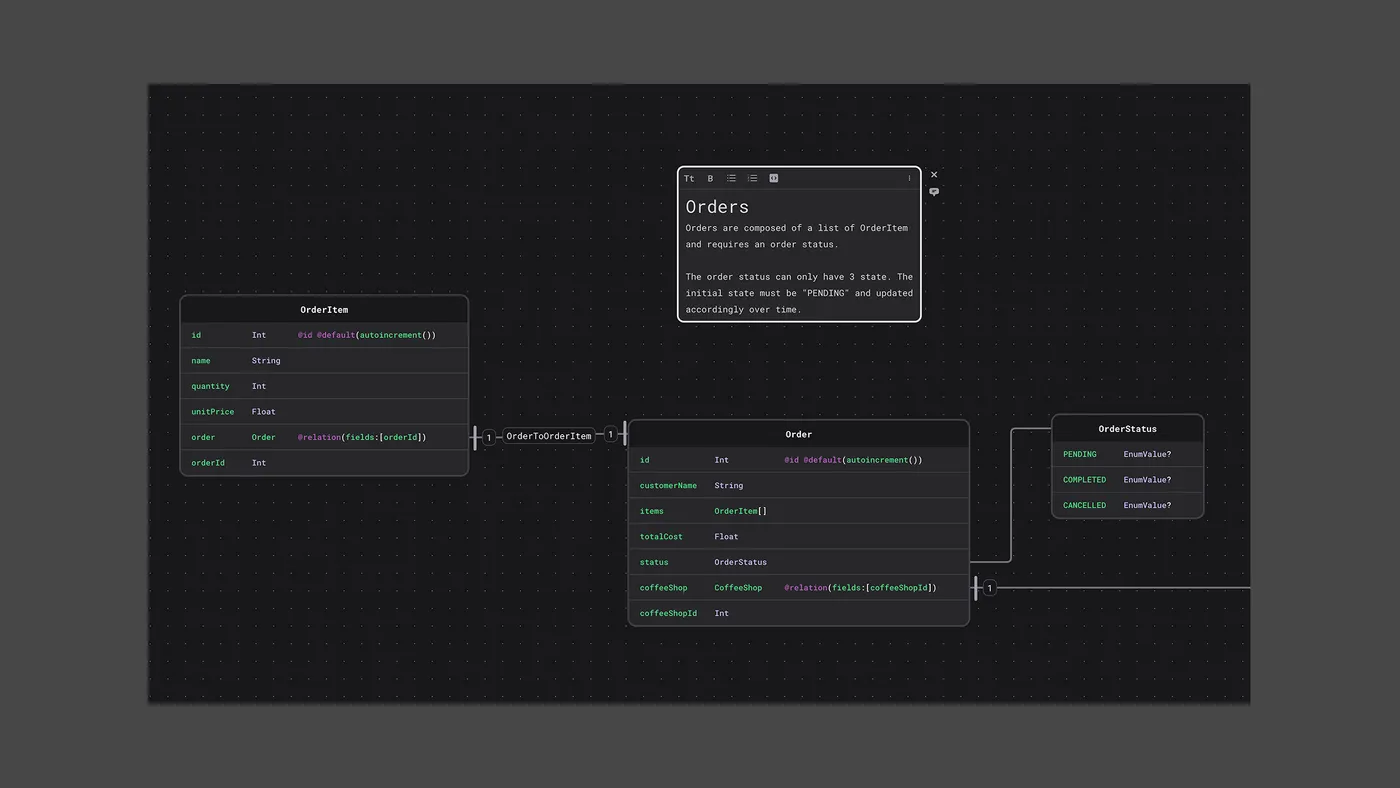
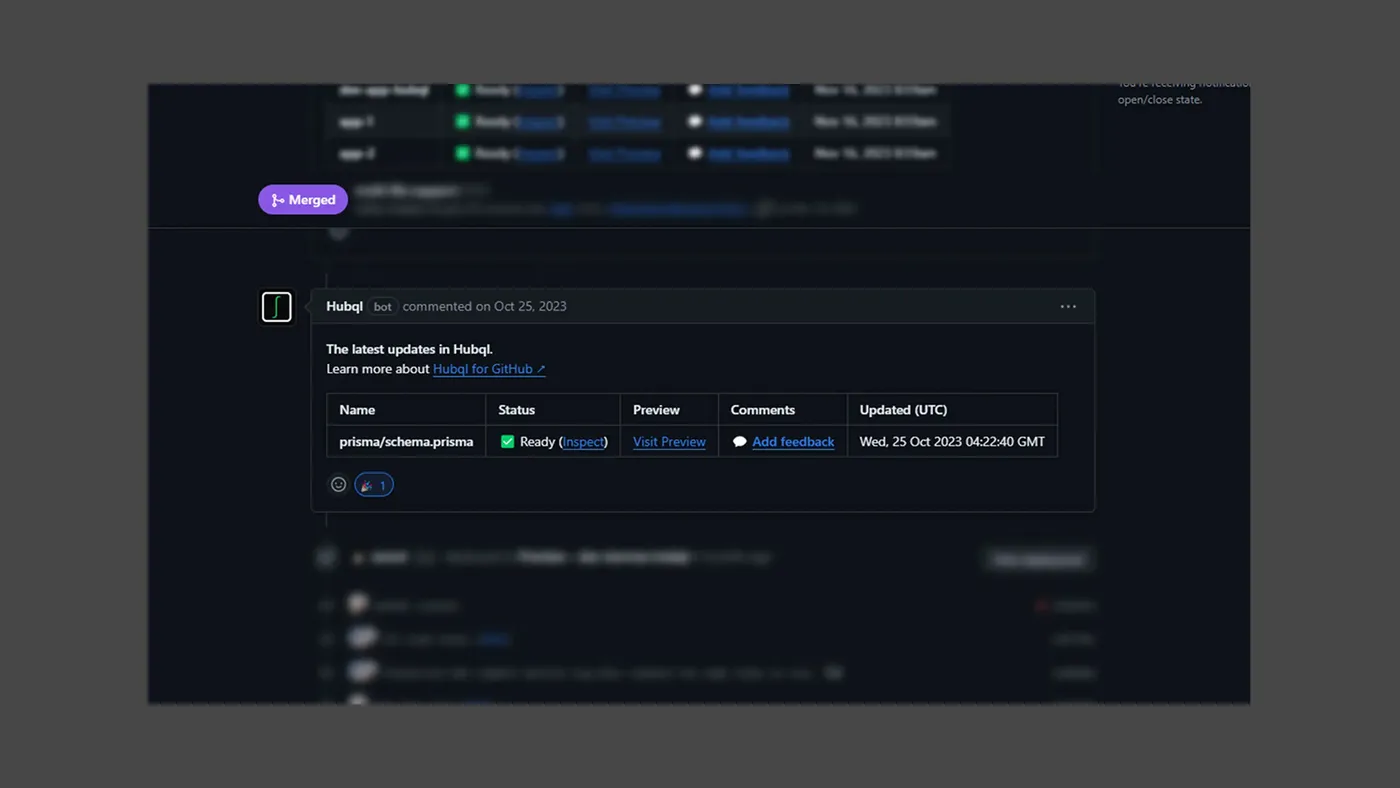
Graph-based visualization platform supporting multiple formats (GraphQL, Prisma, JSON, XML, Protocol Buffers) with GitHub workflow integration.
Technical Implementation
Built modular parsers transforming format-specific schemas into canonical representations. Implemented Canvas/WebGL rendering maintaining 60fps with 300+ entities. Developed WebSocket-based collaboration using operational transformation for concurrent editing. Created bidirectional GitHub sync generating automatic PR preview links.
Key Features
- Automated schema visualization with intelligent layouts
- Real-time collaboration with inline comments
- GitHub PR integration with diff visualization
- Always-current living documentation
Impact
Teams adopted PR previews consistently, eliminating workflow overhead. Non-technical stakeholders engaged directly with schemas without translation. User feedback: "PR previews save us at least an hour per review" and _"external partners understood our API in one meeting instead of three."